7 Ocak 2014 Salı

                   GRAPHSKETCH.COM
As we understand from its name , Graphsketch helps us to sketch graphs.And to use graphsketch you dont need to download.You can use it online whenever you want.Its not very professional but it is very helpful about sketching basic graphs.


                                                                  Graph part of software

                                              Equations and settings part of sotware


Like all sketching software , you can sketch your graph easily by writing your equations.You can write your equations both function and parametric type.Sumary you should write your equaiton and click plot.

                                       The graph which is wrote form of functions.
                                                        f(x)=x
                                                        f(x)=3x+5
                                                        f(x)=tan(x)


                                       The graph which is wrote form of parametrics.

                                                       x(t)=1+2t                x(t)=sin(t)
                                                       y(t)=5+3t                y(t)=3t


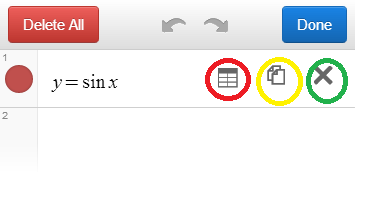
As you see , you can sketch your each graph different colours.There are 6 types of colour. When you click square colourful place near the your functions , you can choose your colour.

Also there is a table that told you what symbols you need to write your equation.
What other buttons?


There is plot button.When you clikc this button, your graph is sketched.
There is reset equations button.When you click this button , your all equations is cleaned.
There is reset everythind button .When you click this button , your all settings and graphs is cleaned.

 Settings 
You can set everythıng what you want about coordinate axis such as range of x and y , tick distance of x and y, label ticks ,  grid , function width and ımage size.


1 Ocak 2014 Çarşamba

                               WWW.NETCALC.ORG

This web page is another software which helps us to sketch graphs easily.Thanks to this web page it is easy to sketch our equations' graphs , their derivatives and their antiderivatives.You can see home page below.


You should write your equations left side of page.This part is for equations.You can write 10 equation same time.You just write your equation and click evaluate and it is sketched for you.And if you click clear button , it deletes all functions.


You can also choose if you want to sketch your equations' derivatives graph.You can see below red area.


There are 5 buttons above the function column.These are evaluate, save graph to desktop , clear functions , help&support and about.


You shoul be careful while you are writing functions.You should use "*" for multiplication.You should use "^" for power.And you should use some abbreviation to  write some functions.


There are also another 5 buttons above the graph part.These are chart, table , details , info and options.


1)CHART
Chart is usual part of web page.You can see in this part your graphs.


2)TABLE
When you click this button , you can see your equations with table forms.X values and Y values for each equation.


3)DETAİLS
When you click this button , you can see your functions , your functions' type , area and mean values.


4)INFO
When you click this button , you can see your functions , your functions' derivatives and their indefinite integrals.


5)OPTIONS
Options button is about axis' appearence.You can determine your x-axis and y-axis ranges.Y(res) and X(res) helps you to determine tick marks.X(scale) is the number of how many times function will evaluate in definite interval.You also set what you want to show or hide.


     DESMOS CALCULATER AND GRAPHER

Desmos is the one of the programs which we used for sketching graphs.You can easily sketch your graphs by writing your equation.Desmos' home page basically consist of three parts.These parts are graph part , keyboard part and equation part.You can see basic appearance of desmos below.


To sketch graph you should only write your equation left side of page, then desmos sketch graphs otomatically.You can examples below.


                                                   Example of y=x graph.


                                                      Example of y=sinx graph.


You also sketch a lot of graphs in one time.


                                                   Examples of y=3x , y=cosx and y=x^2

To write symbols and other functions click the functions button on keyboard and select your function.


By clicking settings button , you can change the colour of graph , copy , convert to table and delete your graph.

settings


convert to table
copy
delete


By clicking plus button you can also add different things like expression, text, table and folder.


When you click the table , new screen is opened which you can see below.You should write your values and desmos determine your point.You can change colour of your points and graph and you can bond your points from settings button.


When  you click untitled graph button , the list is opened.You can choose a lot of different functions from this list.There are 31 types of function.This list is not only functions , ıt helps you a lot of things like slope ,parabolas , circles and others.When you click one of them , desmos shows you example.


If you dont want to use fixed numbers for your graph , you write your equations with unkown value and desmos creates sliders for your each unknown.Thanks for this your graph will be more dynamic.


REMARK : You can hide or show your graph by clicking colourful ball which is head of the your equation.

Finally , desmos have 3 buttons in right up side.These buttons is helps you to use desmos more comfortable.
1)Key button : These part include three parts , graph paper, window and trigonometry settings.These settings is used for your desmos' appearence.


2)QuestionMark Button : This button helps you to use desmos.You can learn everything about desmos.


3)Language Button : You can choose language which you want to use.


1 Aralık 2013 Pazar

Applıcations of Logarithms

pH ve pOH

         Aqueous solution [H +] and [OH-] concentration is usually very small concentrations to facilitate                 transactions by taking the base-10 logarithm of negative concentrations are expressed in                               integers .Logarithmic expressions that are used in calculations. Aqueous solution [H +] ion concentration       minus the base-10 logarithm.


Notes

         Frequencies of the notes are arranged in a system log. Piano's thick (la) sound frequency is 27,5 hertz.
       If the reference value is 27.5, and the array If the logarithm base 2 we obtain the following value
       è0,1,2,3,4,5,6, ve 7.. Notes using different coatings for different frequencies is possible to obtain logarithmic.


Psychology
         Logarithms occur in several laws describing human perception:Hicks law proposes a logarithmic relation between the time individuals take for choosing an alternative and the number of choices they have. Fitts's law predicts that the time required to rapidly move to a target area is a logarithmic function of the distance to and the size of the target. In psychophysıcs, the Weber Fechner proposes a logarithmic relationship between stimulus and sensation. such as the actual vs. the perceived weight of an item a person is carrying. (This "law", however, is less precise than more recent models, such as the Steven's power law.)
  Watch the video about applications of logarithms.


You can watch the video to learn about properties of logarithms.


Derivative and Antiderivative


Analytic properties of functions pass to their inverses. Thus, as f(x) = bx is a continuous and differentiable function, so is logb(y). Roughly, a continuous function is differentiable if its graph has no sharp "corners". Moreover, as the derivative of f(x) evaluates to ln(b)bx by the properties of the exponential function, the chain rule implies that the derivative of logb(x) is given by
\frac{d}{dx} \log_b(x) = \frac{1}{x\ln(b)}.
That is, the slope of the tangent touching the graph of the base-b logarithm at the point (x, logb(x)) equals 1/(x ln(b)). In particular, the derivative of ln(x) is 1/x, which implies that the antiderivative of 1/x is ln(x) + C. The derivative with a generalised functional argument f(x) is
\frac{d}{dx} \ln(f(x)) = \frac{f'(x)}{f(x)}.
The quotient at the right hand side is called the logarithmic derivative of f. Computing f'(x) by means of the derivative of ln(f(x)) is known as logarithmic differentiation.[40] The antiderivative of the natural logarithm ln(x) is:
\int \ln(x) \,dx = x \ln(x) - x + C.
Related formulas, such as antiderivatives of logarithms to other bases can be derived from this equation using the change of bases.


Propertıes of Logarithms


  •  \log_b(x y) = \log_b (x) + \log_b (y) \,
  • \log_b \!\left(\frac x y \right) = \log_b (x) - \log_b (y) \,
  • \log_b(x^p) = p \log_b (x) \,
  • \log_b \sqrt[p]{x} = \frac {\log_b (x)} p \,

The logarithm of a product is the sum of the logarithms of the numbers being multiplied; the logarithm of the ratio of two numbers is the difference of the logarithms. The logarithm of the p-th power of a number is p times the logarithm of the number itself; the logarithm of a p-th root is the logarithm of the number divided by p.

Change of Base

The logarithm logb(x) can be computed from the logarithms of x and b with respect to an arbitrary base k using the following formula:
 \log_b(x) = \frac{\log_k(x)}{\log_k(b)}.\,
Typical scientific calculators calculate the logarithms to bases 10 and e.Logarithms with respect to
any base b can be determined using either of these two logarithms
 by the previous formula : 

 \log_b (x) = \frac{\log_{10} (x)}{\log_{10} (b)} = \frac{\log_{e} (x)}{\log_{e} (b)}. \,


Common Logarithm

Logarithms to base 10 are called common logarithms. They are usually written without the base.When the base is not written , you can understand that it is common logarithm.


Natural Logarithm


Logarithms to base e are called natural logarithms. The number e is nearly 2.71828, and is also called the Eulerian constant after the mathematician Leonhard Euler.It is usually shown lnx.